Categories
Other

Sample Digital Critical Edition: Kinder- und Hausmärchen (Children’s and Household Tales)

Date: Spring 2020

View this project here

This is a sample of a digital critical edition of the Brothers Grimm’s Kinder- und Hausmärchen. It contains the same paragraph from Rapunzel from each of the seven editions of Kinder- und Hausmärchen with the changes made between the current edition and the last highlighted in blue and accidental textual variants corrected and highlighted in green. I also provide a direct translation of the text to English for each version of the paragraph and links to the original page images from the Deutsches Text Archiv. This was one of my first experiences examining how digitizing material can provide one new opportunities for analysis.


Categories
Other

Practicum 2.0

Date: Winter 2022 – Spring 2022

Partner(s): Jade Kandel, Ephraim Benson, John Groos, and Haruki Yoshida

View this project here

For my senior thesis for the CS major, I worked with a team to extend the existing educational software Practicum that teaches introductory computer science concepts. My teammates and I worked on implementing functionality for teaching classes and objects and then ran an experiment to determine the effectiveness of the software. In particular, I worked on designing and integrating visual representations of objects into the tool. This is my first experience building educational software.

Categories
Other

Using Agglomerative Clustering to Group PDFs by Format

Date: Fall 2021

View the code associated with this project here

This code seeks to group PDF page abstractions (images of the first page with black boxes where text is) using an agglomerative hierarchical clustering method. This work ties into the Tools for Tracking Police Misconduct Data project and seeks to group PDFs with similar formats so that a single information extractor method can be written for each type of PDF. This is the first project I have undertaken that uses artificial intelligence techniques and required me to approach text analysis from a different perspective.

Categories
Other

Tools for Tracking Police Misconduct Data

Date: Summer 2021 – Spring 2022

Partner(s): Pragya Kallanagoudar

My work on this project is part of a much larger effort to help the National Association of Criminal Defense Lawyers and several journalistic organizations create a database that tracks police misconduct. I worked on identifying police misconduct cases by querying a larger database of legal cases, extracting relevant information from PDF versions of case files, and creating human-in-the-loop tools to allow for the verification of my program output. This is the second large-scale academic research project I have been a part of and my first experience building specialized tools for an audience I am receiving regular feedback from.

Categories
Other

Interrogating Bias in the Hiring Process

Date: Winter 2021

Partner(s): Juliana Bachulis

View this project here

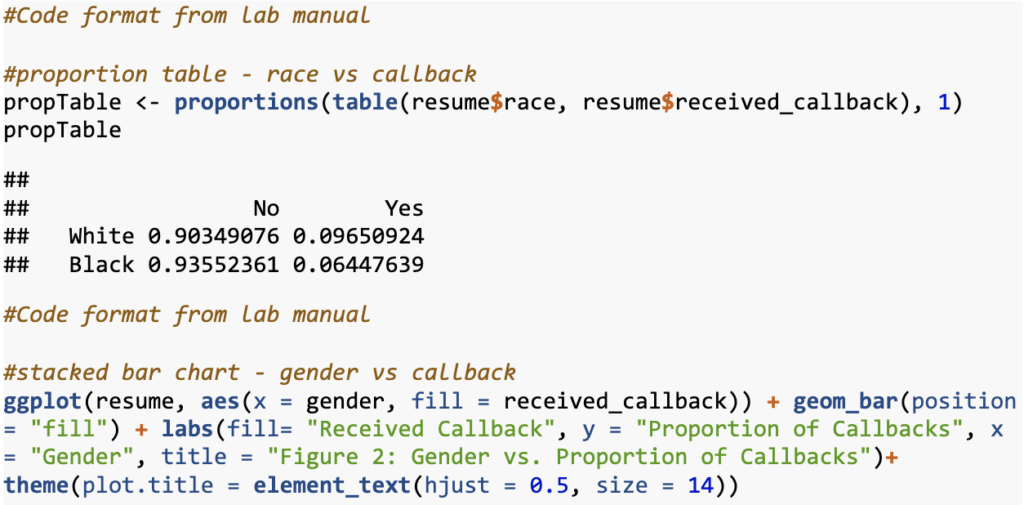
In this project, my partner and I analyzed data on hiring bias using statistical techniques in R. This is the first project I undertook in R and it taught me how to apply statistical analysis techniques to real world data to construct a coherent argument.

Categories
Other

Seattle Library Explorer

Date: Fall 2020

Partner(s): Josiah Misplon

View the code associated with this project here

For this project, my partner and I designed a database that stores information on checkouts from the Seattle library system and a website that allows users to query this database in several ways. This was my first experience designing databases in SQL and creating a web application from scratch, and the only time I have undertaken a full stack project of this magnitude. It built my understanding of website and user interface design, skills which have been important to my work since.

Categories
Other

Wiki Project: Paris – Religion

Date: Winter 2019

Partner(s): Peter Quayle

View this project here

This is the first Digital Humanities project I undertook. I was part of a much larger group focused on creating a wiki on early medieval cities. For this project, my partner and I focused on studying and writing a wiki page on religion in early medieval Paris. This experience introduced me to presenting humanities research digitally.

Categories
Data Visualization

“Let every word weight heavy of her worth”: Examining How Women Enact Power in Shakespeare’s Comedies through Interactive Speech Pattern Visualizations

Date: Winter 2022

Threads: Data Analysis, DH Feminism, Data Visualization, Distant Reading, Open Data, Humanities Visualization

View this project here

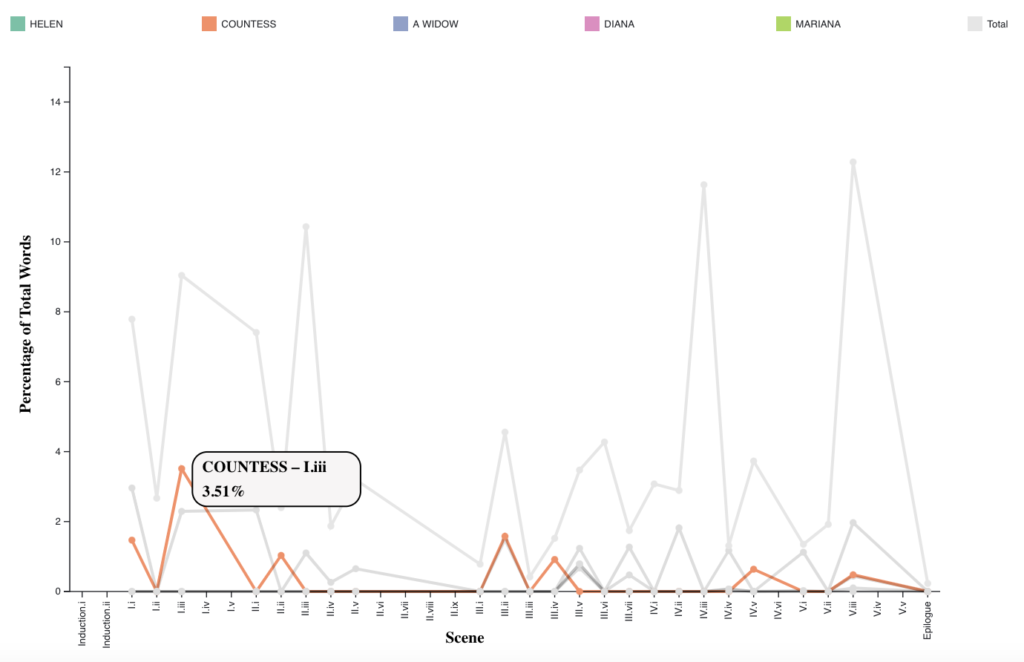
This project was my senior thesis for the English major. In it, I analyzed how women enact power in Shakespeare’s comedies by visualizing their speech patterns. I hand-annotated each comedy for who talks to whom, designed and coded visualizations to present the speech pattern data, and then wrote an essay analyzing the visualizations and contextualizing my work within previous literary and DH analysis of Shakespeare. This is the largest research project I have undertaken solo and it allowed me to execute a project from conception to execution. It was also the first time I explicitly used a feminist lens in creating and analyzing a visualization. This work is set to be published as part of the QuaDramA workshop proceedings in September 2022.

Categories
Data Visualization

Examining World Energy Production and Usage

Date: Winter 2022

Partner(s): Bridger Rives

View this project here

This project, another interactive tool built with Shiny in R, examines energy consumption and generation trends by continent. In particular, it looks at energy consumption and generation from renewable versus fossil fuel sources using machine learning (in particular random forests), chloropleth maps, and interactive bubble charts. This project allowed me to further develop my ability to create apps and interactive visualizations with R. It also gave me further experience integrating several kinds of data analysis into a cohesive argument.

Categories
Data Visualization

Exploring Continental Vaccination Data

Date: Winter 2022

Partner(s): Bridger Rives

View this project here

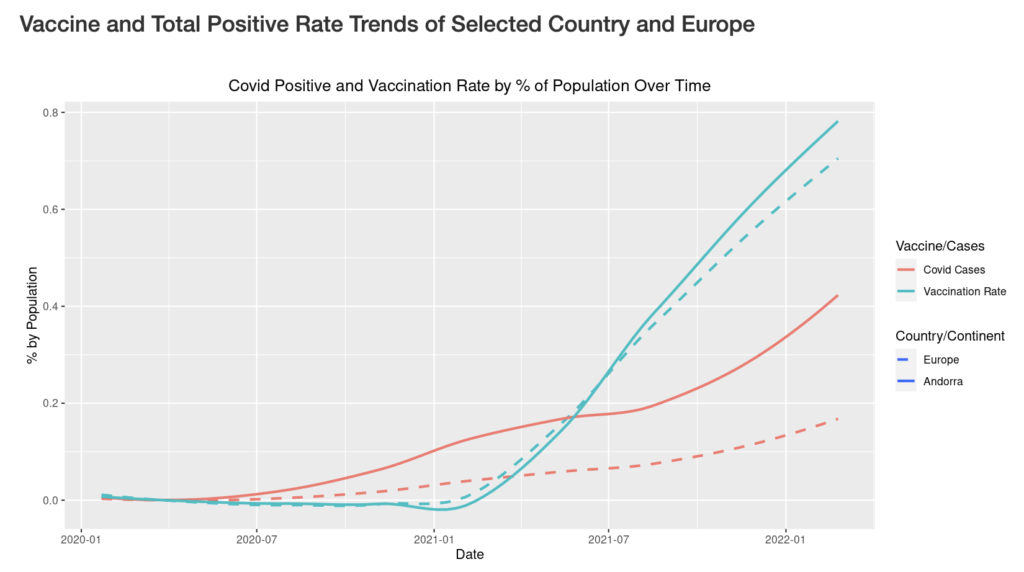
This project, an interactive tool built with Shiny in R, explores trends in coronavirus positives and vaccinations in Asia and Europe. It displays the top and bottom four countries by positive covid and vaccination rates in a user selected year and a chloropleth (or heat) map of the relative covid positives or vaccinations in each country in Europe and Asia. In creating this project, I learned how to build tools and interactive visualizations in R.

css.php