Date: Winter 2021
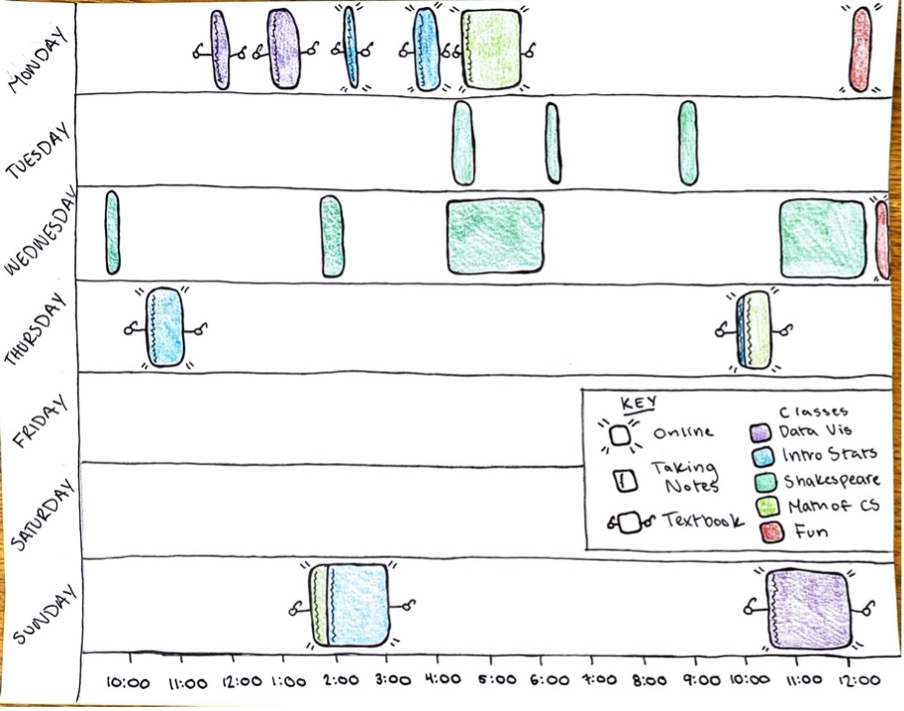
This essay describes a visualization I designed and hand-drew. The visualization depicts data I collected on my own reading habits over the course of a week. This project, inspired by the Dear Data project created by Stefanie Posavec and Giorgia Lupi, was my introduction to designing specialized visualizations for specific datasets, a concept that has been central to much of my DH work since.